Like this? Follow me:
I’ve been planning my future Sawatch adventure and the more I looked at it, the more I realize that the reputation of the Sawatch being full of gentle heaps of talus hills and nothing else is only true if you decide to ignore some nightmare ridges just off to the side from the more popular 14ers. Those ridges of course are one in the same with the where I want to travel on.
Update: Caltopo has just changed their default settings, so that all lines < 190 miles will default to using a 100′ sampling interval. Thanks Caltopo! You can view the discussion on r/Ultralight giving their reasons.
Details of that terrain and how I plan to handle it may be something I’ll write about later, but I stumbled upon a huge issue with my elevation gain/loss estimate. I wanted to know the distance of technical crux stretch of ridgeline that I had determined. If I knew the distance, I could then estimate how long it’ll take me to hike it. Elevation gain for the section would be helpful, too.
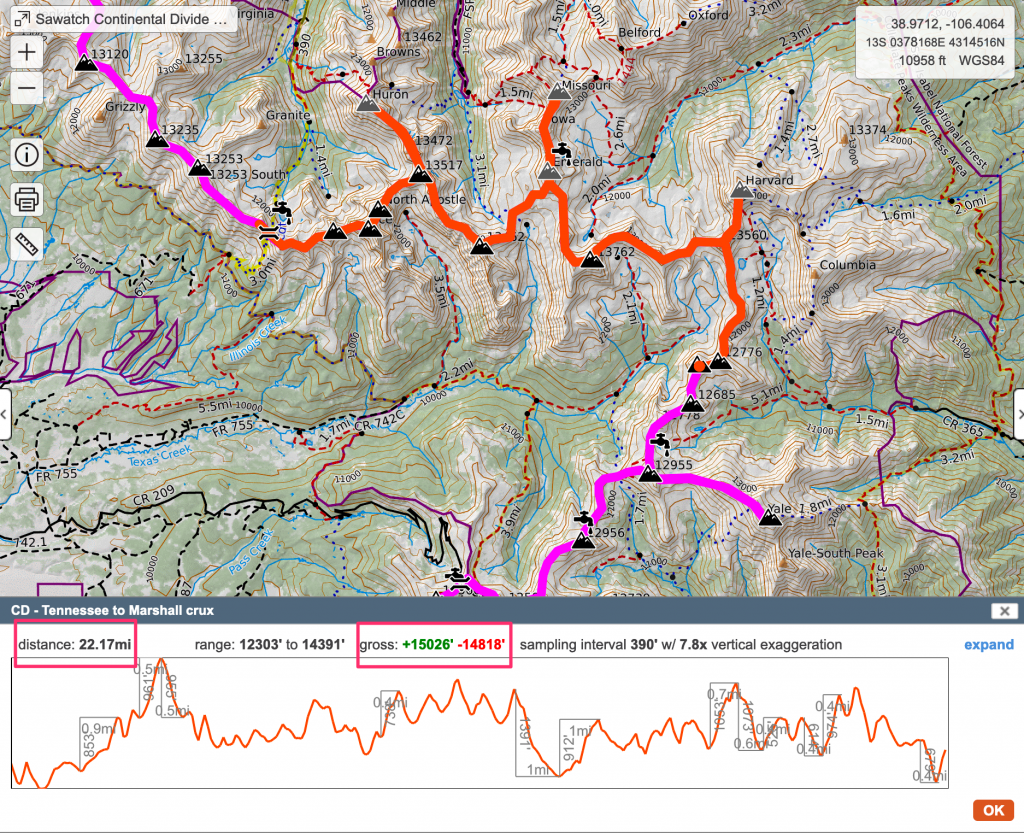
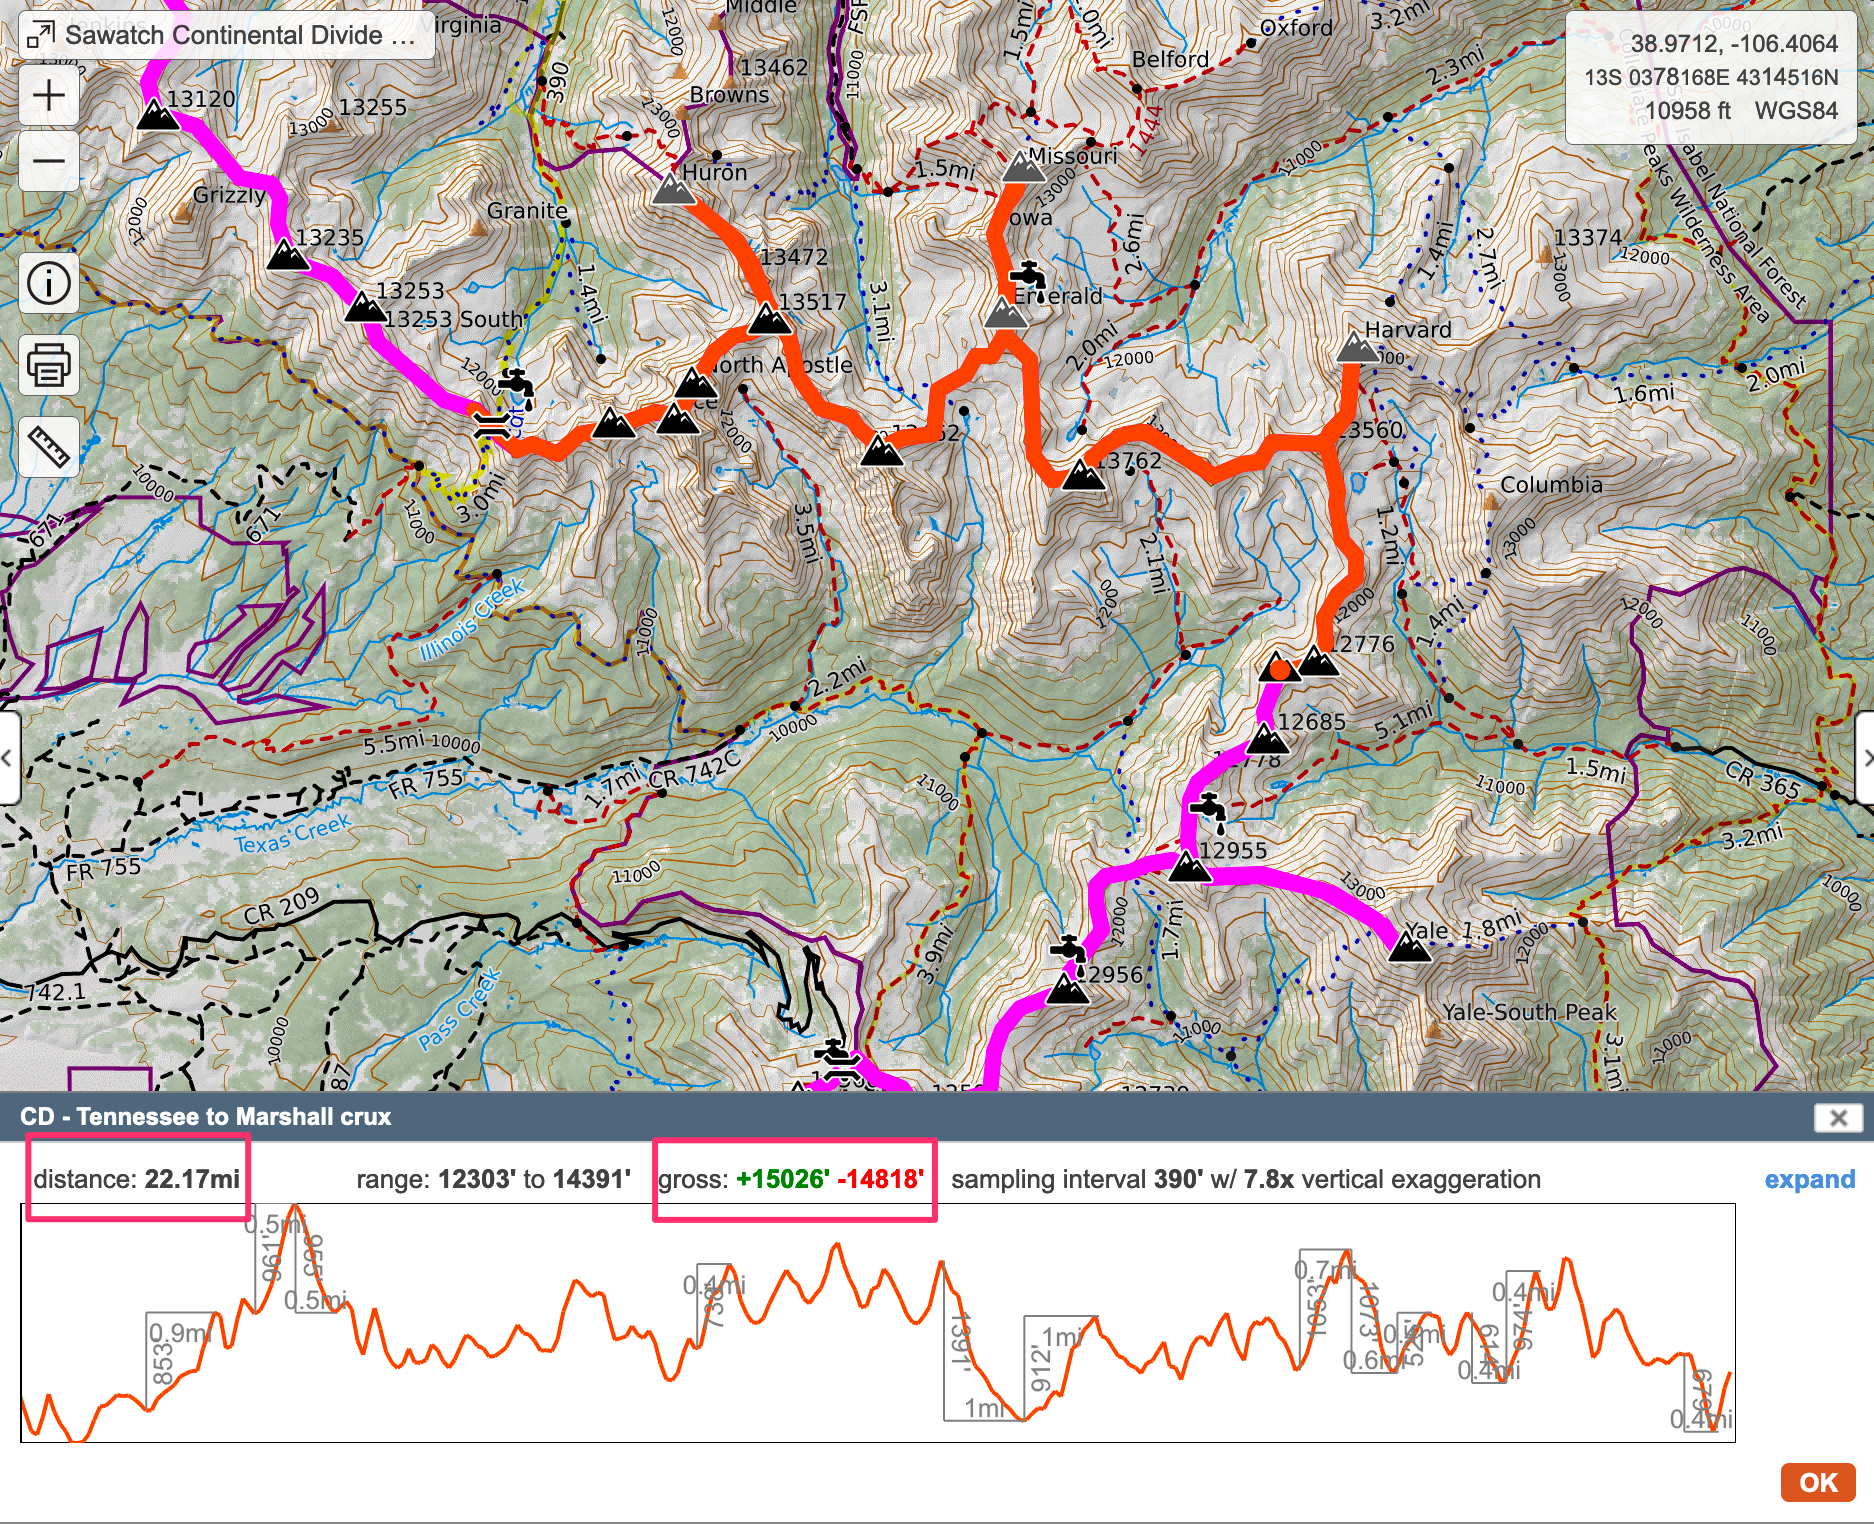
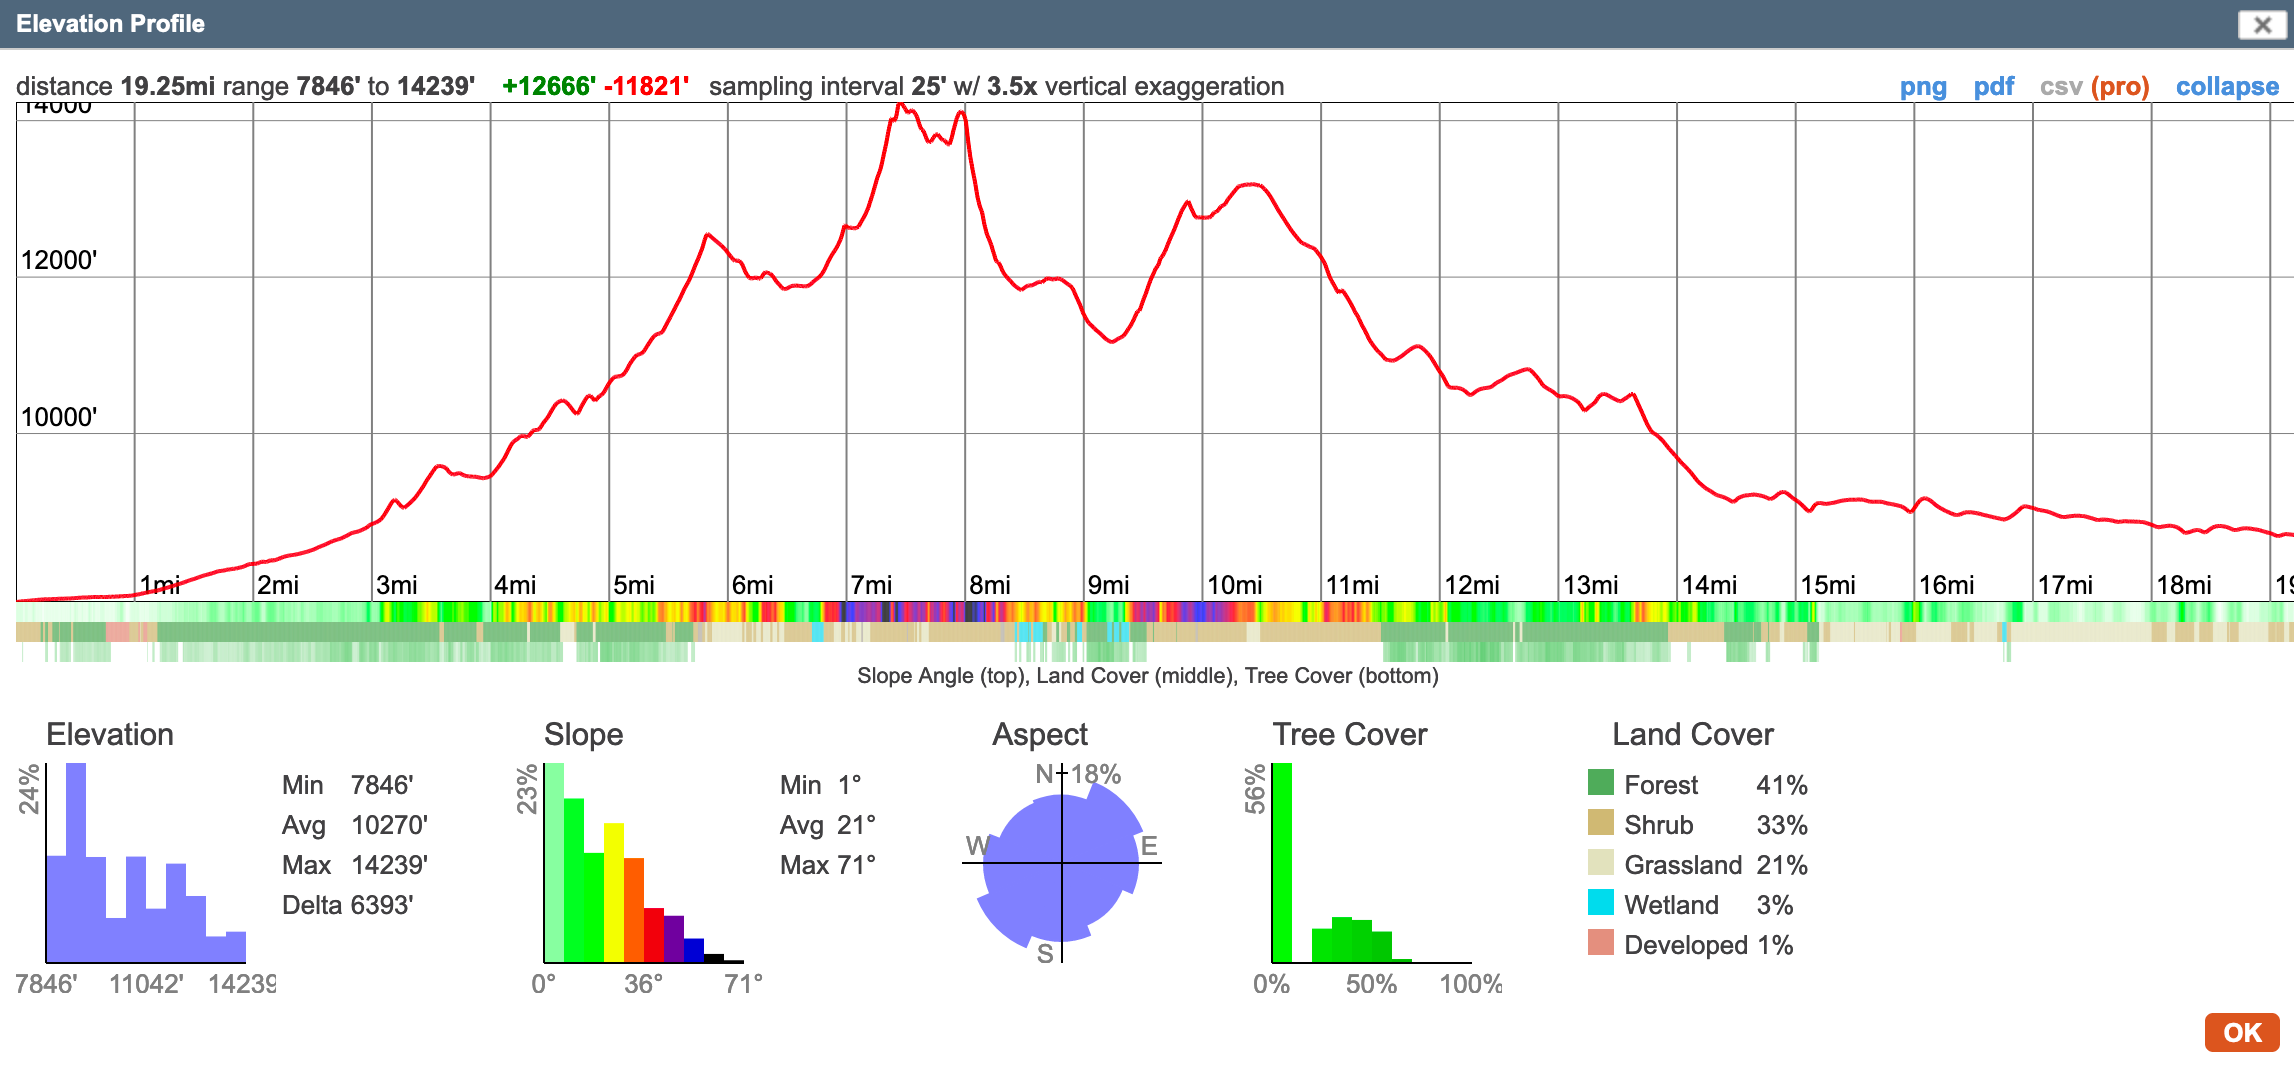
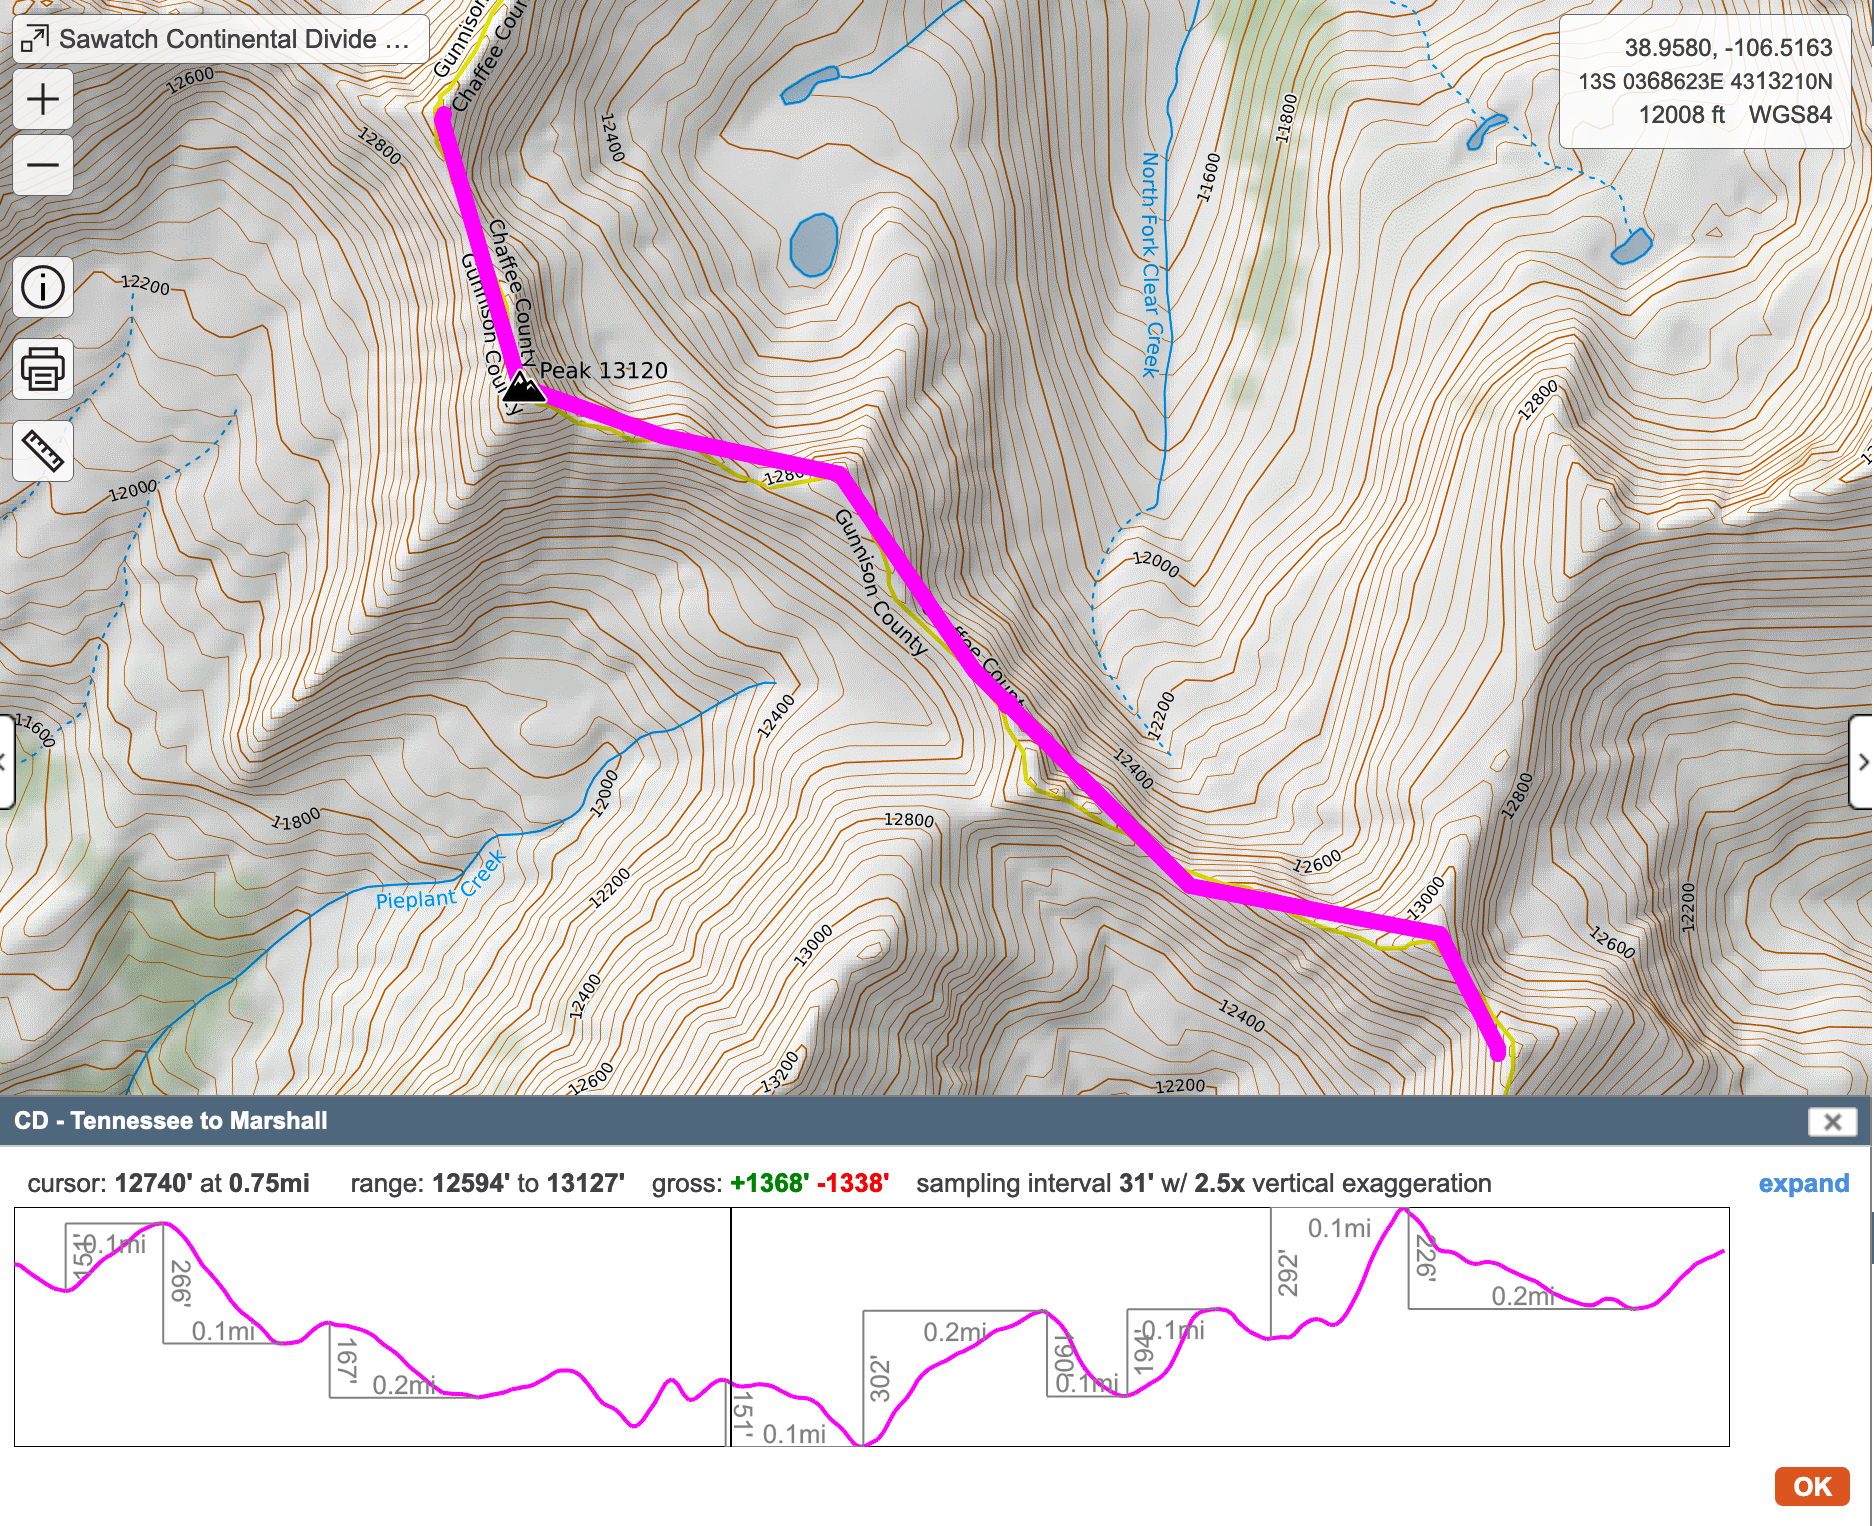
So, I fired up the map in Caltopo (which you can view and play with, yourself), made a copy of the main route, split the copy into pieces, and removed the hunks I wasn’t interested in. What’s left was that crux part – about 22 miles, at least a day of travel for sure. Here’s the segment of the entire trip in bright red – the rest of the trip is in magenta:
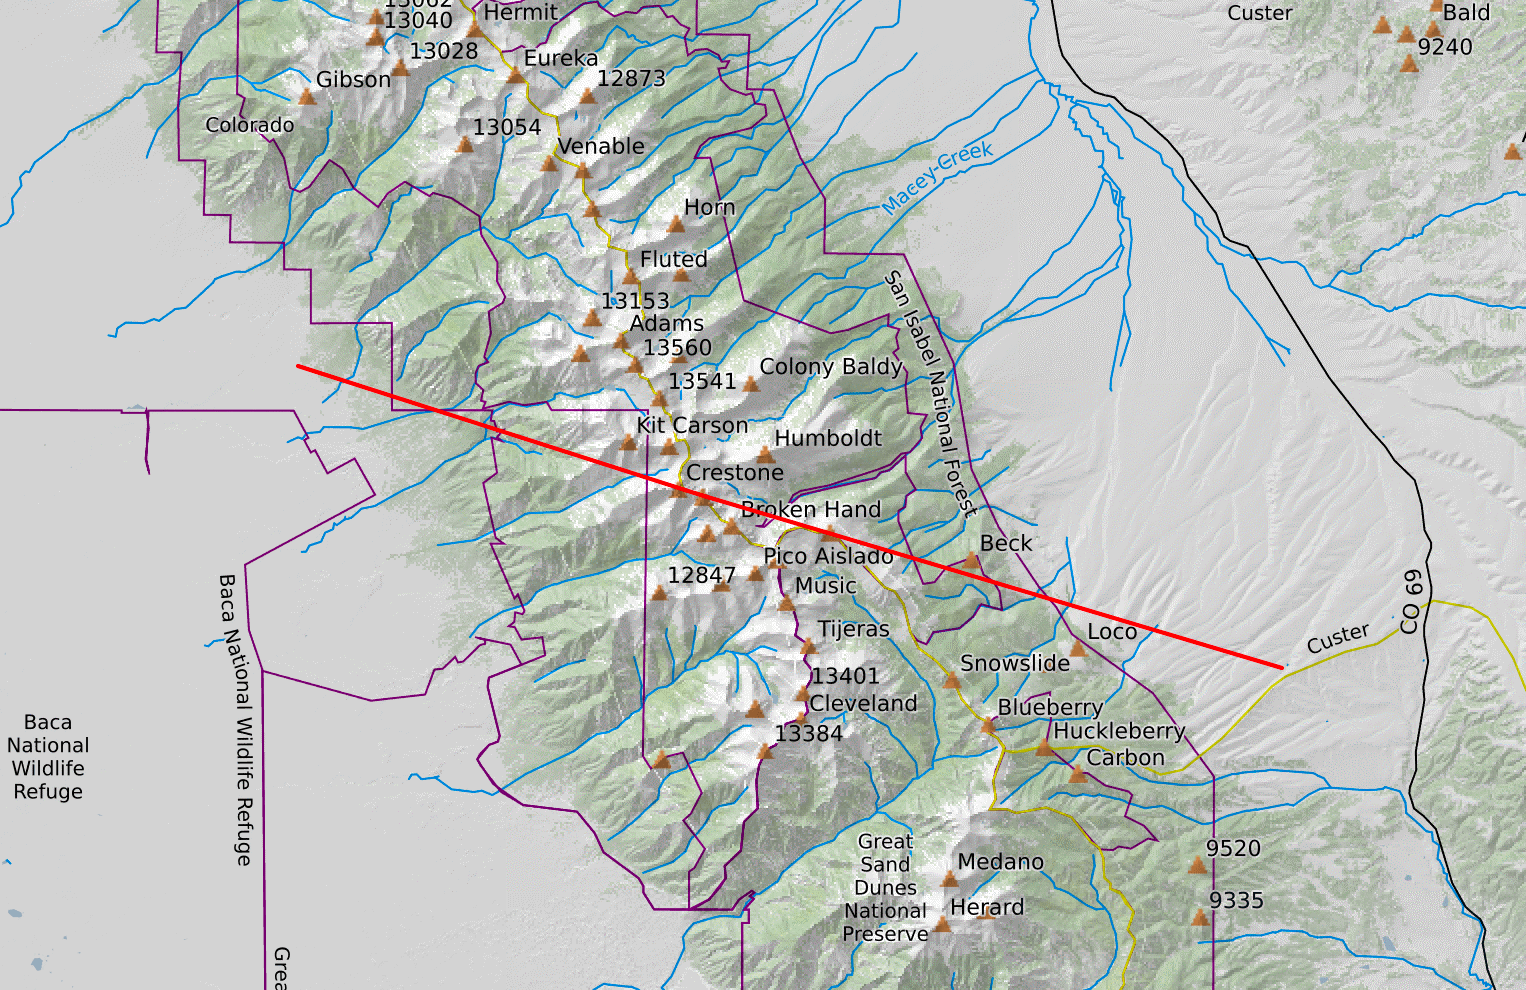
But I also saw something I didn’t expect – the total elevation gain was… 15,000′?! In 22 miles? That is steep, but it is a ridgeline with lots of climbing, so it seemed within reason. What was actually weird is that Caltopo was also estimating the total elevation gain for the entire 130 mile route to be only 36,000’+.
No way was a little less than half of the total elevation to be found in only 22 miles of the route – the entire route is mountainous. What’s going on?
I rechecked the distance/elevation profile for the entire route just be sure. Yup: 36,000′ or so:
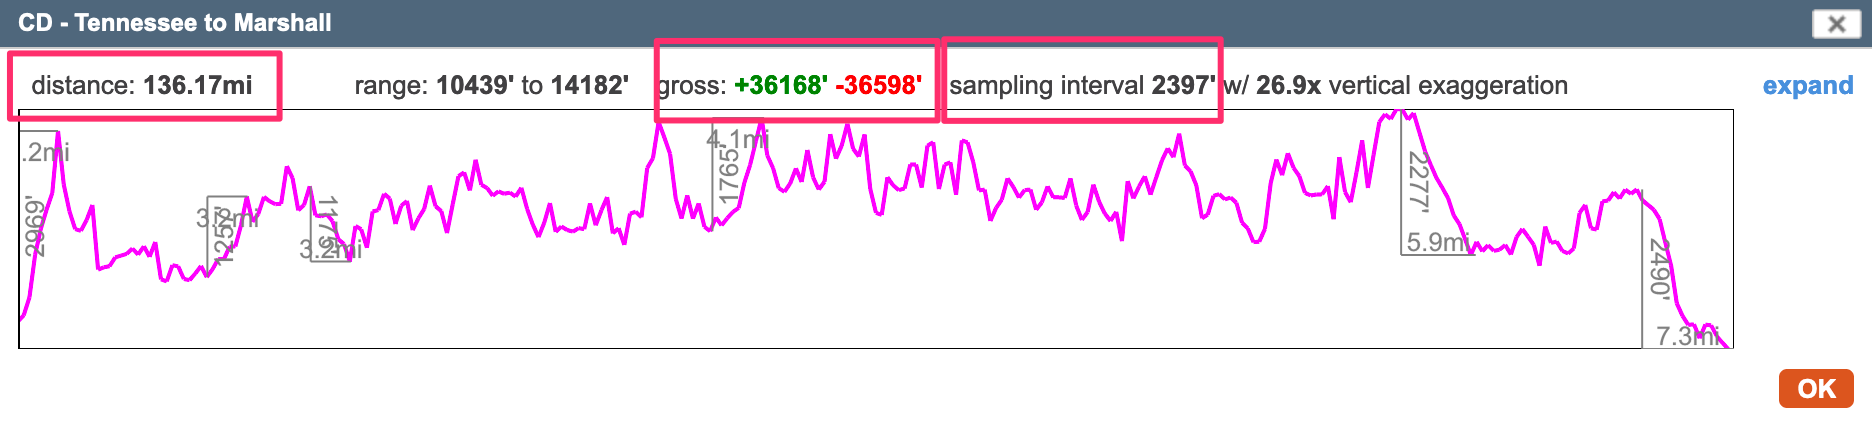
Then my heart sank – as I realized that the sampling interval for the 130+ mile full route was much longer than for the 22 mile segment: 2,397‘ vs. 390′ – YO! So, we’re not actually comparing the route and the crux segment the same way!
The sampling interval for the entire route is ridiculously long – to be honest, the sampling interval for just the crux segment is a little too long for a good estimate. Caltopo has limitations, and its calculations will need to be completed and gotten back to you sometime this week, so it makes sense that it’s doing what it’s doing. What’s tricky is realizing that there will be two sample sizes for two different lines and the sample size is based on total distance (it seems to me) of the individual line.
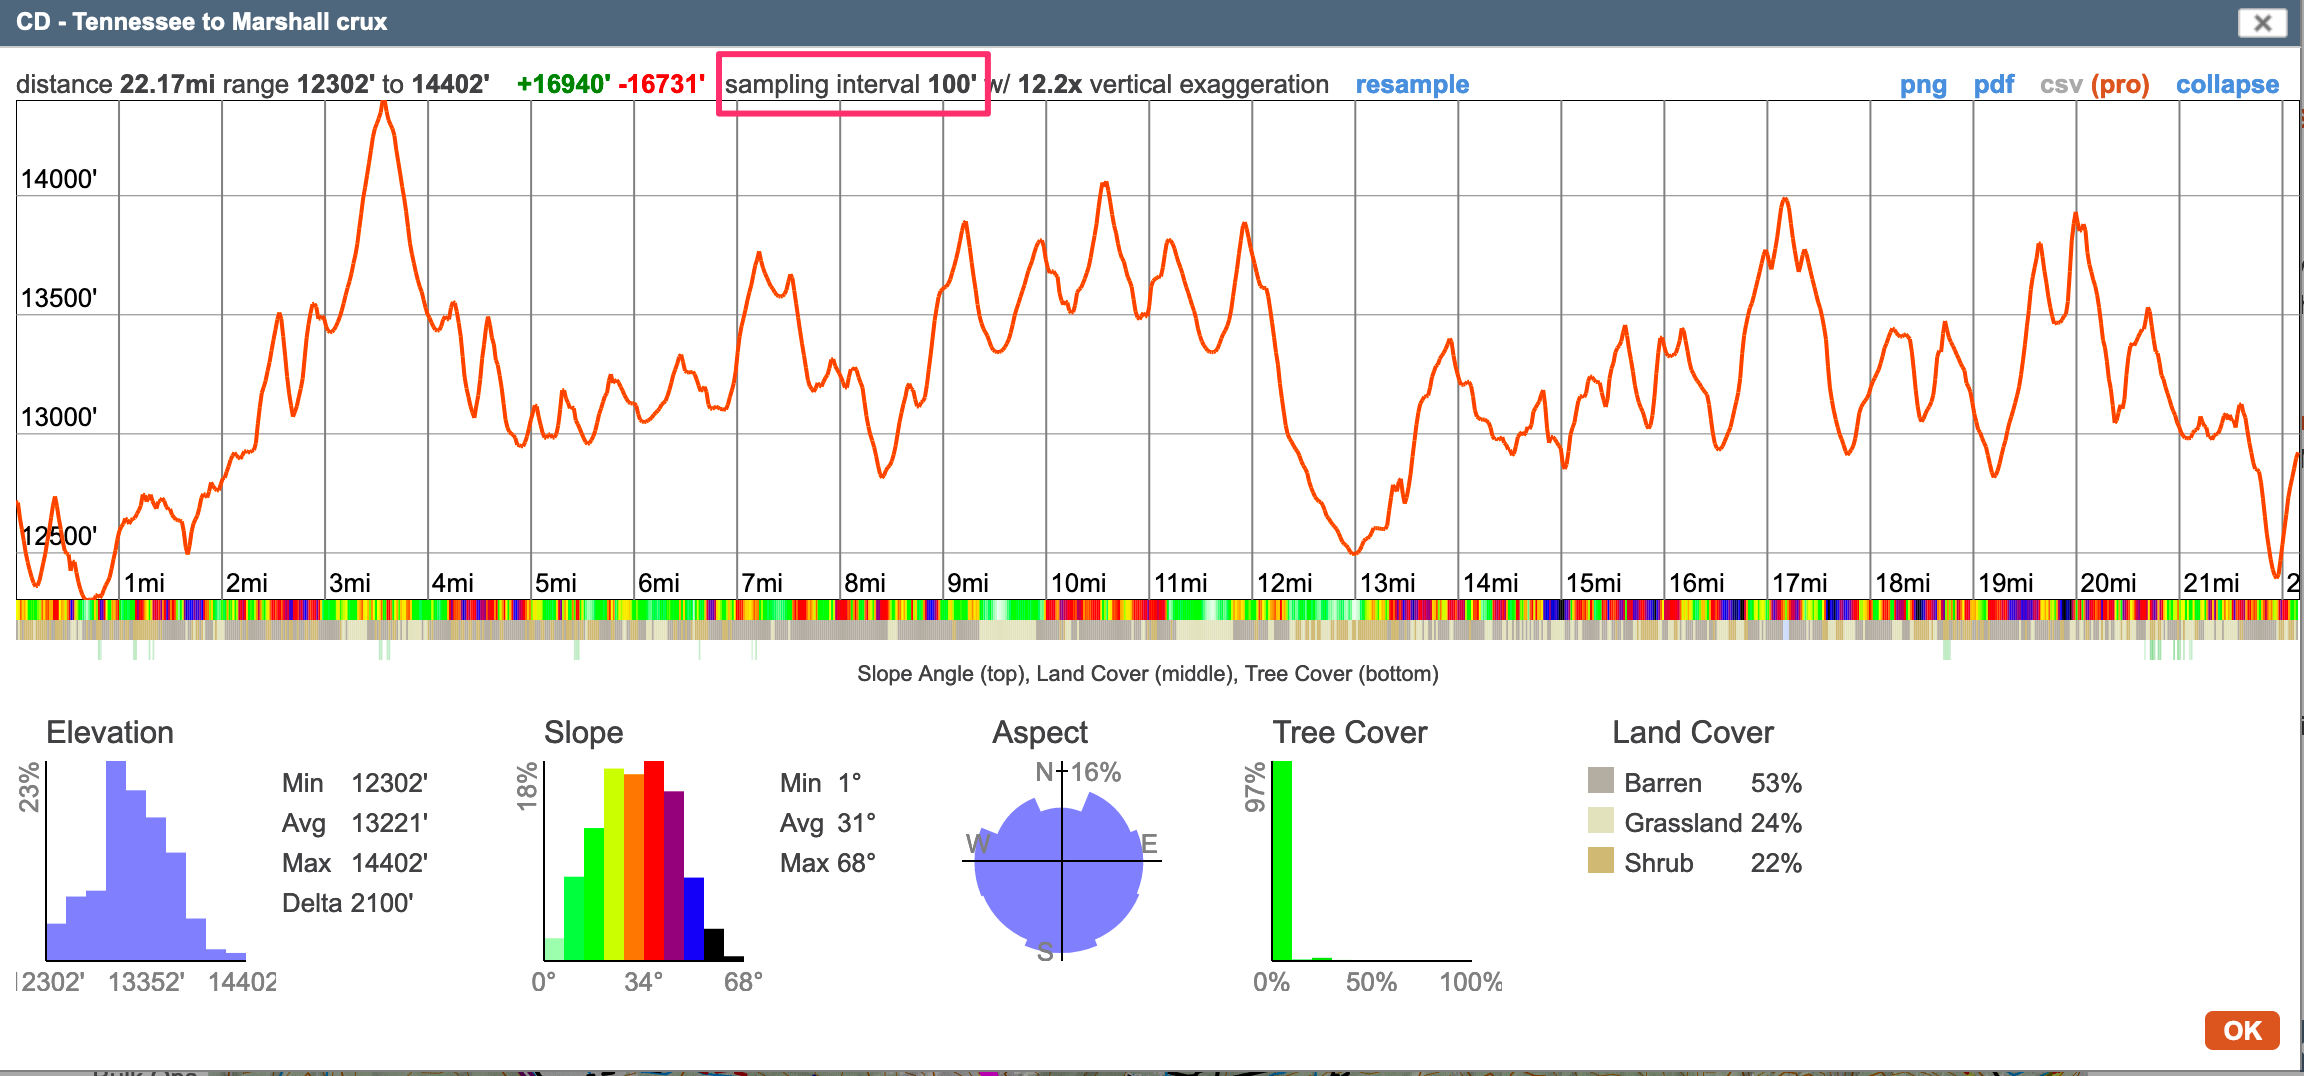
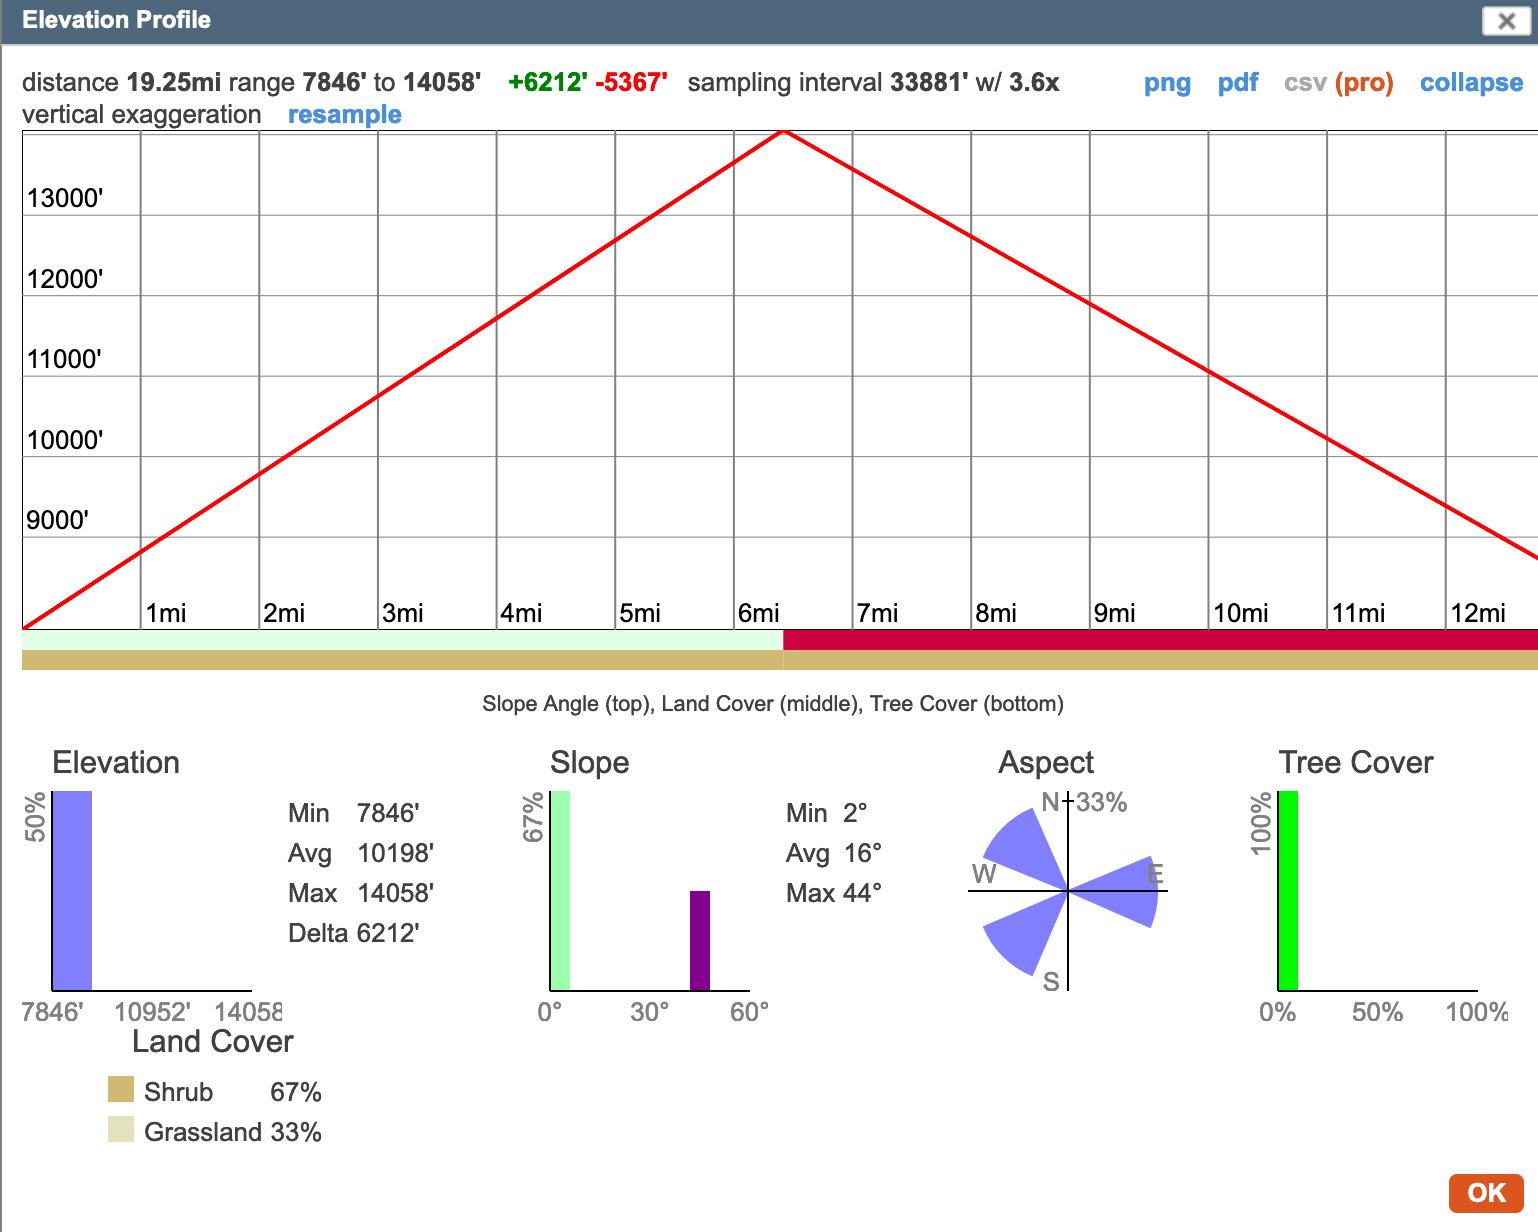
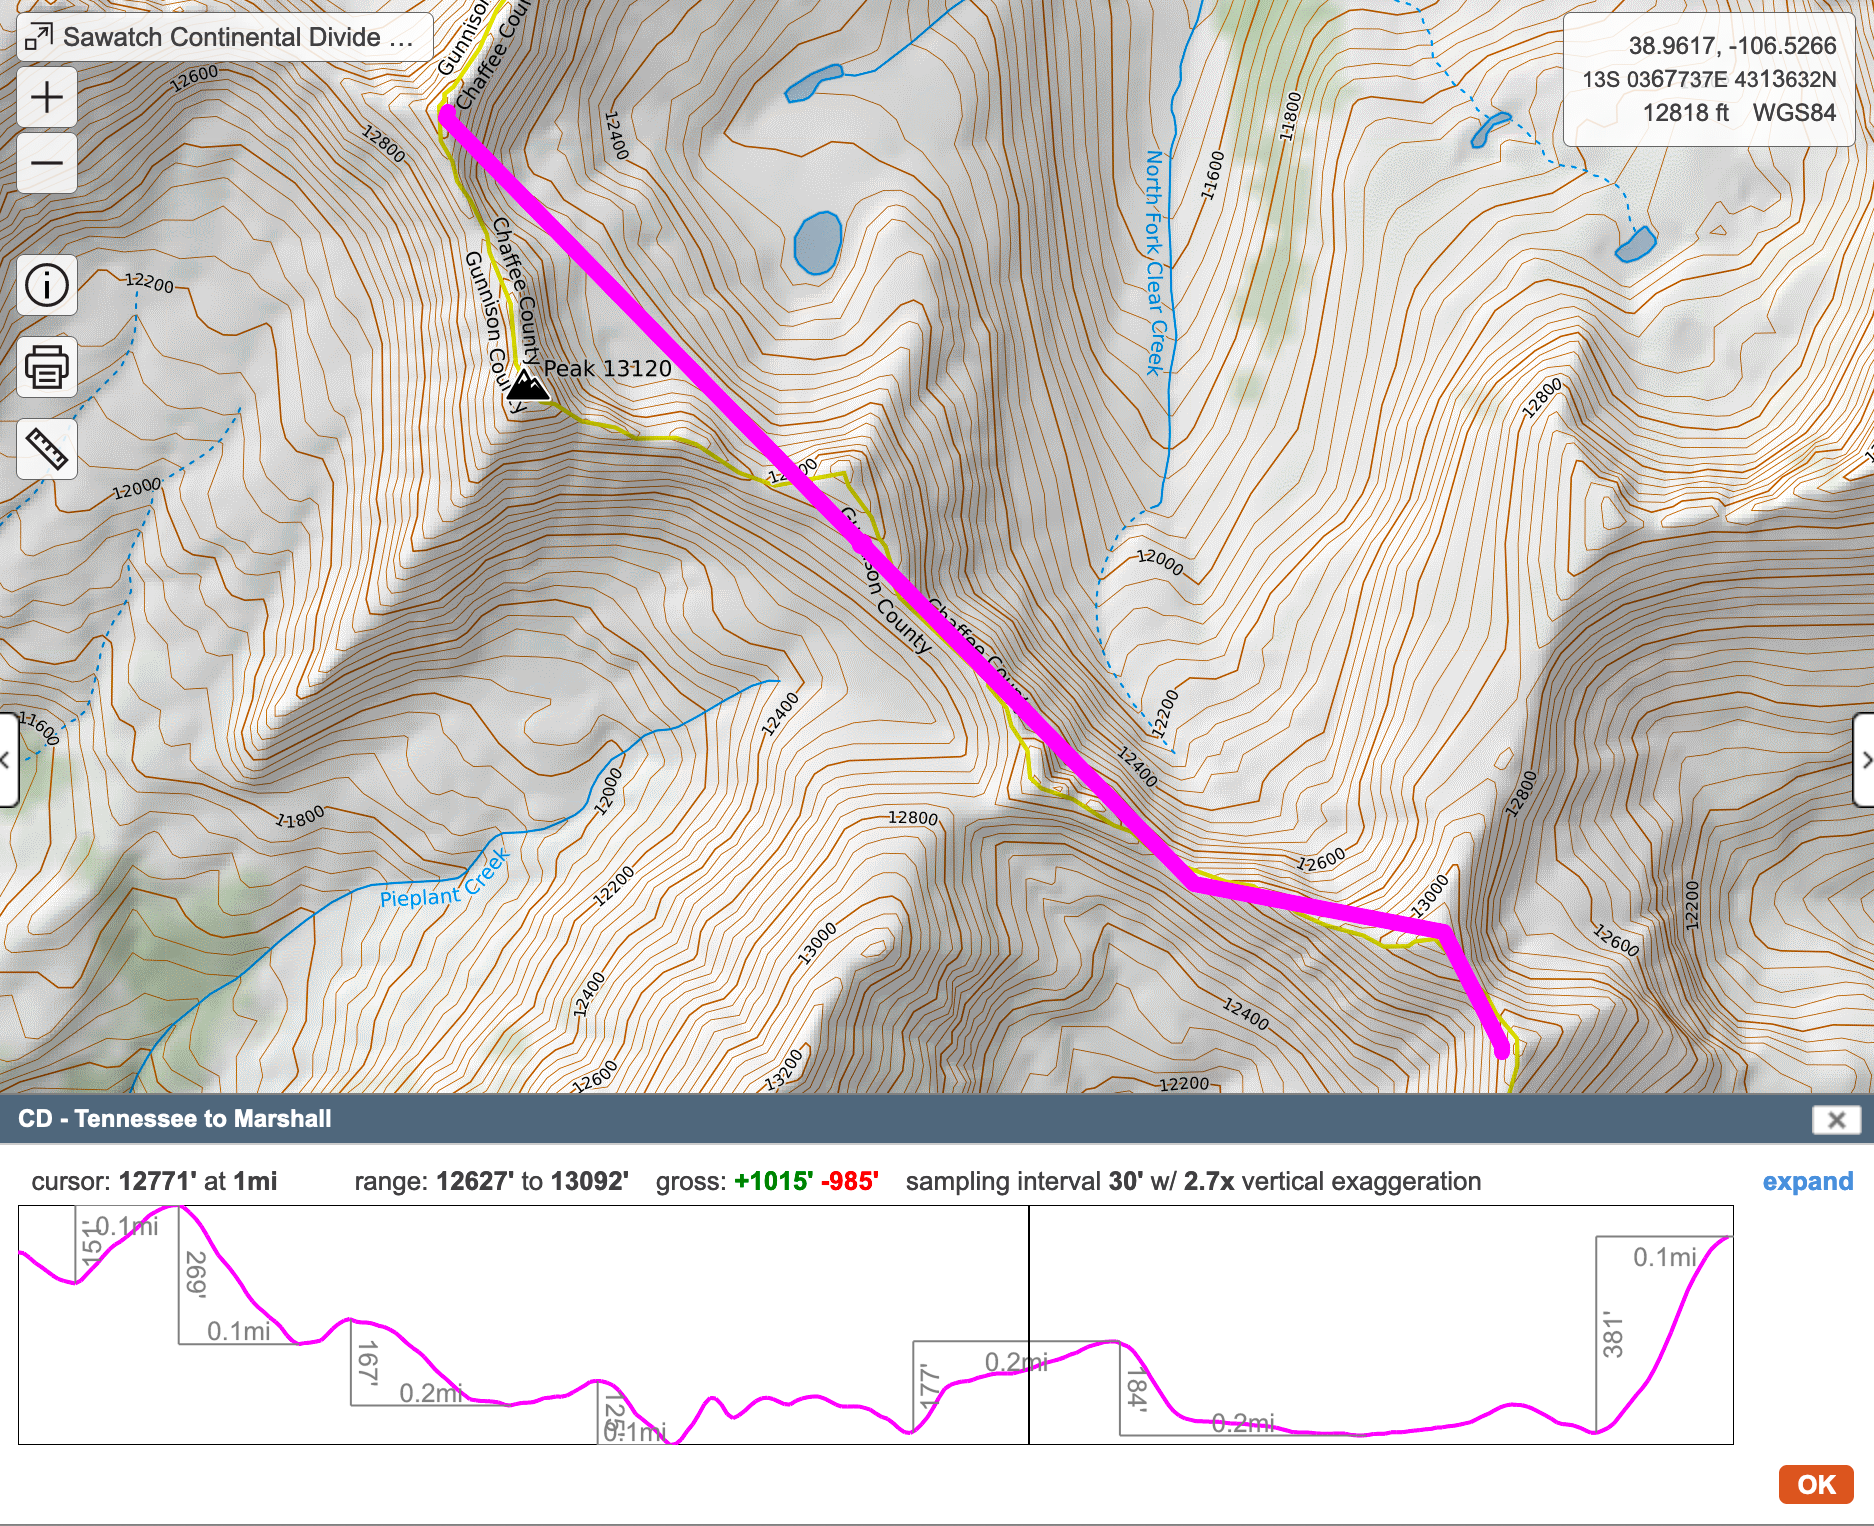
Thankfully, you can try to adjust this. In Caltopo, expand the Profile to see the full Terrain Statistics. Where the sampling interval is listed, there’s a link labeled, resample that’ll allow you to change the same distance. For the full route, I could only get the sample distance down to 100′ (from 2,397′) – but this is better than almost a half a mile! Here’s the results for the full route:

65,000’+! That’s almost twice as much elevation gain/loss as the original sampling route. Hoo-boy. Doing the same resampling change to 100′ (from 390′) for just the crux section:
Also changes things from ~15,000′ to ~17,000′. A difference, but not quite as drastic. I had a sneaking suspicion my original estimates were off, but now I know for sure they’re more towards 65k’ than 36k’. (There’s no way to save this change in sample length though – which is a shame.)
Of course the problem I’m highlighting is probably exasperated when you are dealing with mountainous terrain – and ridgelines especially, where averaging terrain over a length of a few hundred feet really does make a difference.
Here’s a drastic example of a simple line across the Sangres, with a point at the start, a point on top of Crestone Peak, and a point at the destination:
If we tell Caltopo to resample at only each point – a point is found about every 6+ miles in our line, our elevation profile/estimate look like this – 6,200′.
If we change this to every 25′, things look a little more believable in the elevation profile, and the estimated elevation gain is doubled:
Changing the sampling interval to 50′ or even 100′ doesn’t actually change the estimate elevation gain/loss or the elevation profile all that much.
It may be apparent to you that we’ve just stumbled upon the Coastline paradox, that the more precise our measurements are the more (in this case) elevation gain we’re going to find – although there will be convergence at some point. Caltopo has a set limit of course to their sampling interval of around 25′, so things don’t get too crazy. It’s when you don’t have enough points to sample from where the inaccurate estimates arise, like in my full route being sampled only every half a mile or so. So far I can tell.
One other (minor) problem that you may also want to be aware of is that I drew this line on a map using the tools in Caltopo, rather than importing this track from an actual hike. They’re not very exact in their placement, and I can lay the line down on terrain I may not be able to actually hike on. Let’s zoom in to a portion of the route to show you what I mean:
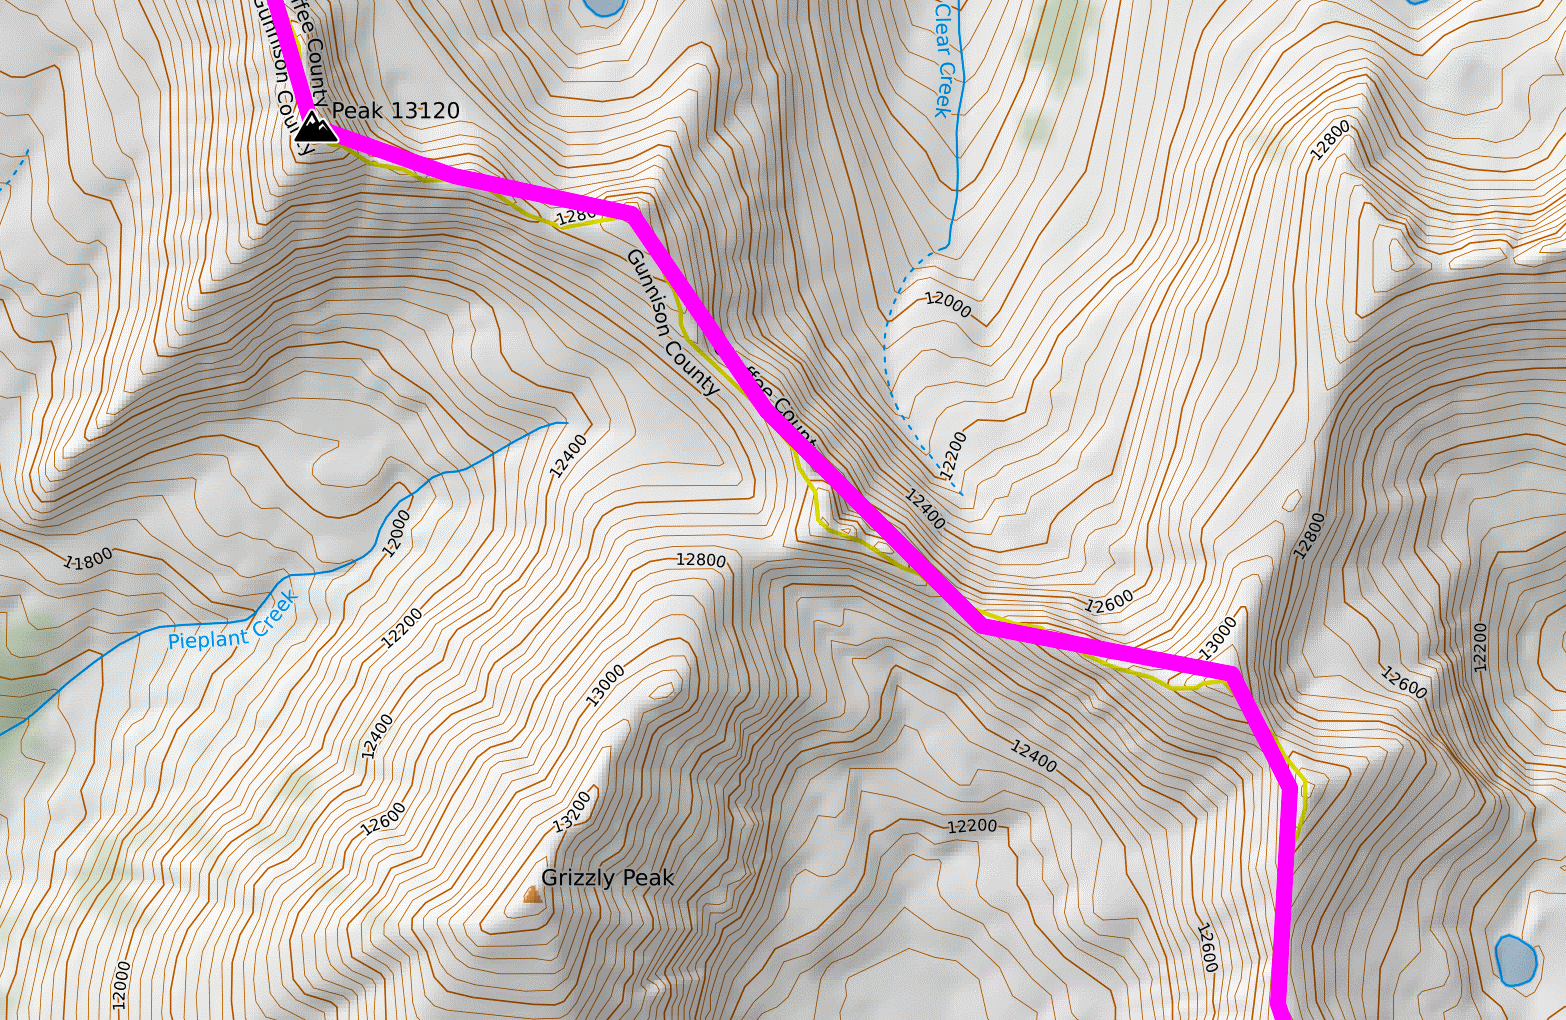
You can see that my line isn’t exactly on the ridgeline – and that’s where I intend to be. There could be both major climbs not being accounted for in the estimate, because I didn’t map this out correctly, as well as some elevation that won’t be counted, because my line is lower than the true ridgeline. Does it matter in the end? Maybe – if there’s huge errors in following the ridgeline, then yes.
Let’s look at just this section:
The ridgeline is followed good enough – not great, but we didn’t miss a large hunk of ridgeline. Now let’s do just that:
We’ve missed 350’+ of elevation gain/loss. So it pays to be at least a little precise.
All this above is really a layperson’s understanding of what’s going on. GPSVisualizer goes into a lot more detail how it’s hard to estimate elevation gain in their tutorial.
Running the GPX that Caltopo creates of both my total route and the crux segment in GPSVisualizer is going to give different results, since they’ll both have different algorithms, apply different filters, and perhaps use a different source for the Digital Elevation Model. GPSVisualizer gives around 52,000′ of elevation gained when graphed – I used 1 meter for the Elevation gain threshold (which is different from Caltopo’s sample length – I’m guessing it uses each point as its sample rate, then applies a filter after that, but that’s all speculation):

And if I haven’t confused you enough, having GPSVisualizer run the GPX of the crux yields only 11,441′ of elevation gain on the section, and not 17,000′.
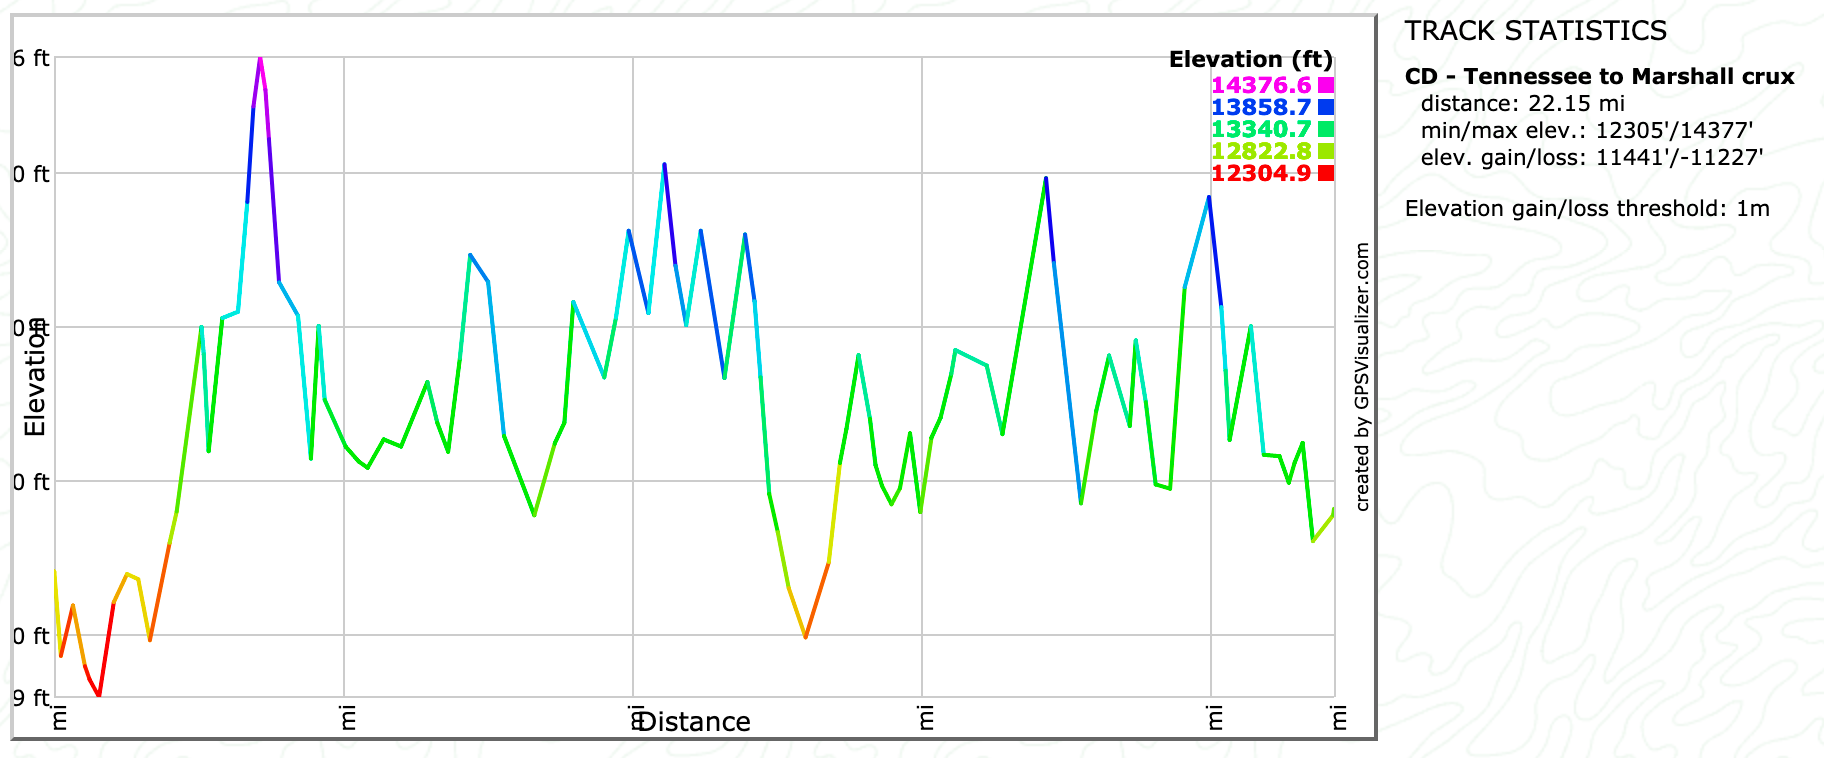
My guess is that GPSVisualizer is really leaning hard on its horizontal noise filter. The docs mention being able to adjust this, but I don’t see the option on the initial form – so it may not be something available in the web-based app. I’ll leave that mystery here for someone else to solve.

Great analysis! I use a combination of Google Earth and my Suunto watch to gather elevation and distance data on my local trails, then I put all my possible segments in a spreadsheet. After a hike I can just select the appropriate cells for my random wanderings and have good elevation and steepness data. The Suunto lags enough with barometric readings that it misses some of the short up-and-down features and gives a lower cumulative elevation gain than the measured data.
I’ve always just assumed Captopo underestimates elevation gain due to sampling, but I had no idea you could change the sampling distance! Thanks for sharing all this info Justin! I’ll definitely have to revisit some of the of projects I have mapped for summer.
Thanks for writing this. It’s good background information on a complicated problem – we consistently get help requests from people who don’t understand why the gain/loss numbers, and even mileage, in CalTopo don’t match up exactly with a race course description, or an official trail profile, or their own GPS track. It’s especially difficult explaining how there is no one correct answer.
Improving the sampling interval has been on the to-do list for a long time, and I’m happy to report that your post helped spur me into rendering that part of your post irrelevant. CalTopo will now use a consistent 100′ sampling interval by default until a line exceeds 10k points, or about 190 miles. It’s still not a perfect solution: I’ve found this is a good fit for carefully-drawn lines, but it’s definitely going to overstate gain/loss for poorly-drawn lines and noisy GPS tracks. However using the same interval regardless of line length, within reason, is still going to be a big step in the right direction.